
Quarterly Scoring Progression and Live Market Variations
 Available in US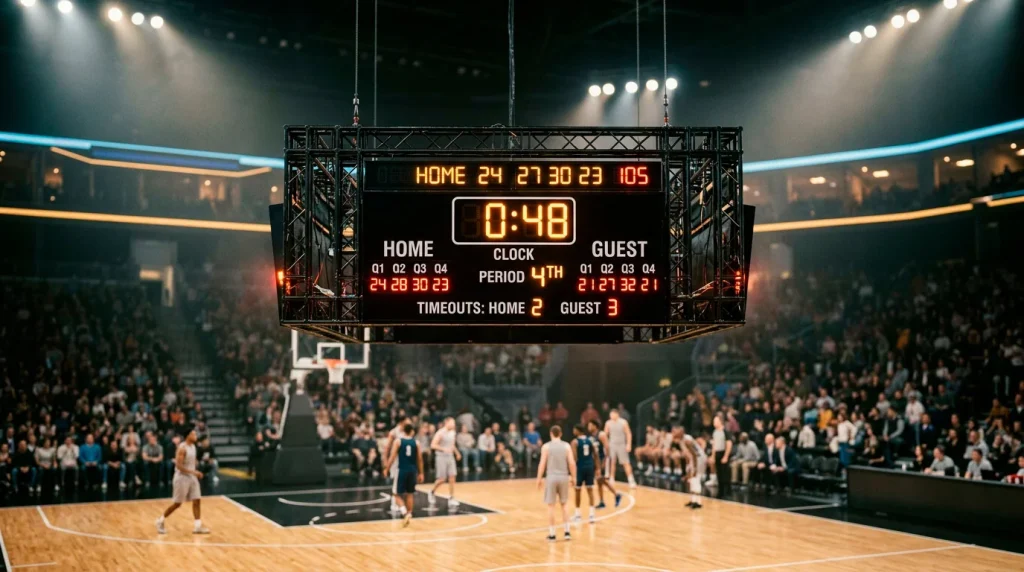
Live Quarter Segmentation: Capitalising on Distinct In-Play Lines
There is a comforting illusion that an NBA game is one long event you bet on once. The reality is that an NBA game is four discrete markets stacked on top of each other, and each one has its own pace, its own efficiency baseline, and its own variance shape. The closing-quarter market does not behave like the opening-quarter market. Live totals priced as if the game were uniform are mispricing the structure of the game itself.
I started building quarterly models seriously after a season in which I went 13-2 on Q4 unders despite a marginal record on full-game totals. The pattern was not a fluke. Quarter four is structurally different from the rest of the game — slower, less efficient, and more affected by game context — and the live market generally underprices that structural difference. This article is the practical version of that read. UK punters trading live NBA markets in the late evening have a real opportunity in the quarterly windows that most casual bettors do not look at separately from the full game.
First-half patterns: pace dominates
The first half of an NBA game is governed primarily by pace. Both teams are at full energy, rotations are stable, and the score is rarely close enough to dictate strategic deviation. The team that wants to play fast does so. The team that wants to play slow does so. The result is that first-half scoring is roughly equal to twice the per-half implied total under the assumption of even quarters — and the deviation from that expectation is mostly explained by which team’s preferred tempo wins the pace battle.
The 2025-26 league context here is important. Average pace has climbed to roughly 104.5 possessions per game, up from 102.7 last season. Most of that pace increase happens in the first half. Q1 in particular is now operating at a higher absolute pace than ever before. Teams come out faster, run more transition early, and the press wave that 20 of 30 teams have committed to forces the first three minutes of each game into a transition rhythm that did not exist a year ago.
For live betting purposes, the first half is the market window where total scoring outcomes are most predictable. Pace is the dominant variable, and pace is one of the cleaner inputs to read. A live first-half over is in play if both teams are confirming their preferred tempo in the opening minutes. A live first-half under is in play if both teams are operating below their season pace, which usually signals foul trouble, bad shooting variance early, or one team forcing the other into a slower style.
The Q3 pivot moment
Quarter three is the most unusual quarter from a betting perspective. It is the quarter where strategic decisions start to matter — adjustments coming out of the half-time break, rotation changes based on Q2 outcomes, and the first signs of game-state-driven pace changes. Q3 is not yet the close-game pace of Q4, but it is the first quarter where the score on the board materially affects how the two teams play.
The empirical pattern is that Q3 scoring is typically a hair below the per-quarter average for both teams when one team has built a meaningful lead by half-time. The leading team protects, the trailing team presses but does not yet abandon its system. Conversely, Q3 scoring runs above the per-quarter average in close games, because both teams ratchet up intensity and execution. This is counter-intuitive — you might expect that meaningful leads would produce more aggressive offence — but the data goes the other way. Close at half-time produces a hotter Q3. Lead at half-time produces a quieter Q3.
The bookmaker’s Q3 total typically does not differentiate between these two pre-quarter states with full precision. A live Q3 under in a game where one team has built a 14-point half-time lead is worth a second look. A live Q3 over in a game where the half-time scores are within five is the mirror.
Q4 pace decay and shooting drop
This is the most important section in this article. Quarter four is fundamentally different from the rest of the game, and the differences are large enough to be the basis of repeatable bets.
The empirical work on this topic is solid. Research analysing more than 2,000 NBA games over a 10-year window found that approximately 19 percent of games entered Q4 with a score margin of 10 points or fewer, and in those close games the median pace in Q4 dropped to between 90 and 100 possessions per 48-minute equivalent. That is dramatically lower than the league-wide first-half pace of 104.5. The mechanism is fouling, deliberate clock management, and slower deliberate offence in clutch situations.
The shooting story is equally important. Research on shot-by-shot performance across quarters found that shooting accuracy declines progressively from quarter to quarter, with an effect size of -1.27 (Cohen’s d) for the drop between Q1 and Q4. The drop is sharper on three-point shots than on rim shots — fatigue, defensive adjustment, and pressure-induced reach all hit three-point efficiency harder than interior efficiency. The combined effect of slower pace and lower efficiency in Q4 of close games produces total scoring outcomes that are 15 to 20 percent below what a naive “per-quarter average” model would project.
For live betting purposes, this is the structural Q4 edge. When a game has produced a high-scoring first three quarters and enters Q4 with a margin of 10 or fewer, the live Q4 total often sits at a price that implies the same per-quarter scoring rate as the prior three quarters. That price is structurally wrong. The pace will slow. The shooting will decline. The Q4 under is the cleaner bet far more often than the live market currently reflects. A blowout-leading-into-Q4 scenario is the opposite — pace stays high, both teams play more loosely, and Q4 over can sometimes be the right side.
How to use this in live markets
The practical workflow is to keep two reference numbers in your head pre-game: what the game’s implied total is, and what 25 percent of that total represents as a per-quarter baseline. Then watch the actual per-quarter scoring and the game state. If the game arrives at the start of Q4 within 10 points and the per-quarter scoring has tracked near baseline through three quarters, the Q4 line is usually set near baseline as well — which is structurally too high given the pace decay. If the game arrives at Q4 with a 15+ point margin, the same Q4 line is closer to fair, sometimes a touch low.
The interaction with full-game live markets is also useful. A Q4 under is more likely to land when the live full-game total has already moved upward through the first three quarters and is sitting above its open. The market is reacting to the actual scoring; the Q4 itself will not sustain that scoring rate. Reading the quarterly market and the full-game live market together gives you a sharper view than either alone. The broader live betting stats framework covers pace pivots, turnover spikes, and shooting variance — the quarterly read sits inside that broader picture as the structural backbone. The other consideration UK punters carry into late-evening NBA wagers is one of broader life and discipline: gambling is one of the modern leisure forms that has changed in ways far beyond what the league or any single bettor controls — as a recent Lancet Public Health Commission noted, digitalisation has transformed the production and operation of commercial gambling, and the industry has built strong partnerships in media and social media, providing operators with marketing opportunities to huge new audiences. The Q4 trades described here are real but small. They are not a path to riches. They are a structural understanding that pays off slowly over years.
Why does NBA pace fall in Q4?
Q4 pace falls in close games because of intentional fouling, deliberate clock management, and slower half-court offence in clutch situations. In blowouts the pattern reverses — pace can stay high or even climb as both teams play loosely. The mediating factor is game state, not Q4 itself.
What"s the typical shooting drop from Q1 to Q4?
Research on shot-level data found an effect size of -1.27 (Cohen"s d) for the shooting accuracy drop between Q1 and Q4. The drop is more pronounced on three-point attempts than on rim attempts. Fatigue, defensive adjustment, and pressure-induced reach all hit perimeter shooting harder than interior shooting.
Should I bet Q4 totals in close games or blowouts?
Close games entering Q4 (within 10 points) produce the cleaner Q4 under edge, because pace and efficiency both decline. Blowouts entering Q4 sometimes produce Q4 over value because both teams play loosely. The pre-Q4 game state is the single most important variable for sizing Q4 total bets.
Articles
Created by the "NBA Stats For Betting" editorial team.
