
Closing Line Evaluation and Bookmaker Efficiency Assessment
 Available in US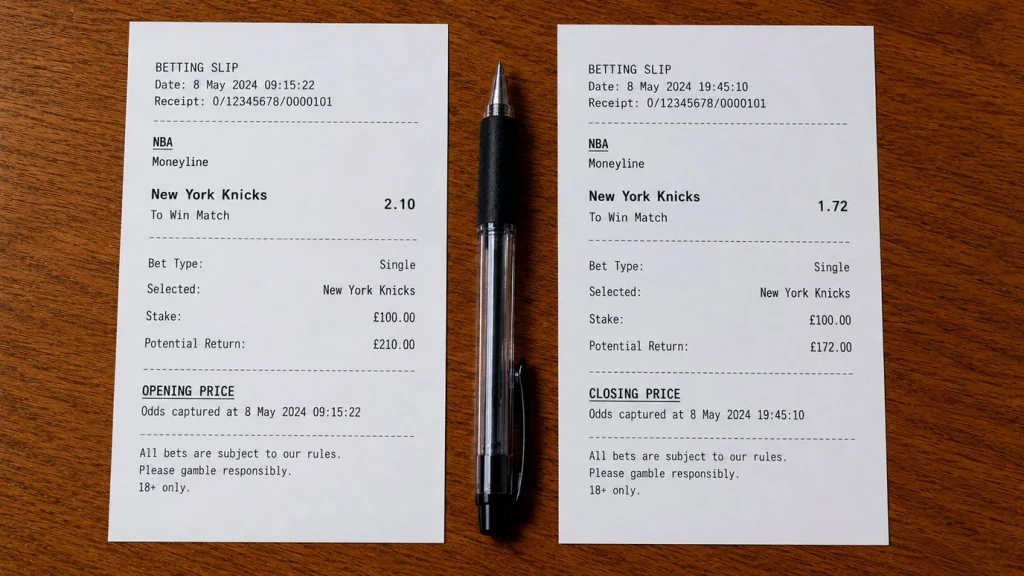
Performance Benchmarking: Verifying Long-Term Yield and Line Value
I have a confession. For my first three seasons of NBA betting I had no idea whether I was a winning punter or a lucky one. My record looked positive. My bankroll had grown. I thought I was good. Then a more experienced friend asked me one question. “How does your bet price compare to the closing line on the same bet?” I had no answer. I had not been tracking it. When I went back and reconstructed six months of bets, the truth was uncomfortable. I was getting worse prices than the close on most of my wins, which meant I had been getting lucky, not skilled. The market was telling me my forecasts were behind, and the bankroll growth was variance I had not yet repaid.
Closing line value, or CLV, is the single most important metric in professional sports betting. It is the question of whether the price you got when you bet was better than the price at which the market closed. If your prices are consistently better than the close, the market eventually agrees with your forecasts and you are showing genuine skill. If your prices are consistently worse than the close, the market eventually disagrees with your forecasts and you are losing slowly even when your record looks positive. This article walks through what CLV is, how to track it for NBA bets, and why UK punters specifically have a structural advantage in capturing it.
CLV defined for NBA bets
The arithmetic is simple. You place a bet on the Lakers -4 at decimal odds of 1.91. The line closes at Lakers -4.5 at 1.91. Your bet has positive closing line value because you got the same price on a more favourable spread. Alternatively, your bet on Celtics over 224.5 at 1.85 closes at 226 with the same 1.85 price. Your bet has positive CLV because the implied total has moved away from your number, suggesting the market eventually agreed the over was more probable than it initially priced.
The cleanest CLV measurement is the difference between your bet’s implied probability and the closing line’s implied probability, on the same side of the bet. If you backed a 50 percent shot at 2.10 and the close was 1.95, your implied probability was 47.6 percent and the closing implied probability was 51.3 percent. Your bet captured roughly 3.7 percent of value relative to the close. Over hundreds of bets, that accumulated CLV is what predicts long-term profitability with high reliability.
The reason CLV matters is that the closing line is the most efficient version of the bookmaker’s forecast. By the time the line closes, sharp money has acted, public money has acted, lineup news has settled, and the market has absorbed everything available. A bet that consistently beats the close has captured an edge that the eventual efficient price agrees with. A bet that consistently lags the close is paying for information you did not yet have.
Why UK punters have a structural CLV advantage
The geography of NBA betting works in favour of UK punters in one specific way. NBA games tip off most commonly between 7pm ET and 10pm ET, which is between midnight and 3am UK time. The final injury reports drop at 4:30pm ET, which is 9:30pm UK time. That four-to-five-hour window between injury report finalisation and tip-off is when most of the meaningful line movement happens.
For UK punters, this window falls entirely within a normal evening. You can have dinner, see the injury news, evaluate the lines, and place your bets before bed. American punters on the East Coast are racing through the same window while juggling work and family. Sharp money on the West Coast is more relaxed but still in the middle of their working afternoon. UK punters often see the final lineup news, and the early line movement that follows, before the bulk of recreational American money has registered the same information.
This timing advantage is meaningful for CLV purposes. The lines at 10pm UK time, an hour after final injury reports, are typically more efficient than they were at 7pm UK time but less efficient than they will be at 1am UK time. Betting in that 10pm-to-midnight UK window often produces prices that move favourably by tip-off. It is not a guaranteed edge — it requires you to have read the news correctly — but it is a window where the maths of CLV consistently favours alert UK punters over both ends of the American time zone spectrum.
Tracking CLV without overcomplicating it
The mechanics of CLV tracking can be as simple or complex as you want. The minimum viable system is a spreadsheet with five columns. Bet date, market, your price, closing price, and CLV delta. You fill in the first three columns when you bet, then update columns four and five just before tip-off. After 50 to 100 bets, you have enough sample to see whether your average CLV is positive, neutral, or negative.
The CLV delta calculation has a few flavours. The simplest is the percentage difference in implied probabilities. If your bet implies 47.6 percent and the close implies 51.3 percent, your CLV is +3.7 percentage points. A more sophisticated version weights by stake size, so larger bets count more. The most advanced version is the “CLV per pound staked,” which gives you a single number representing how much expected value your bet capture is generating per unit of risk.
For most UK punters, the percentage-points version is enough. Track 100 bets. If your average CLV is positive by even one or two points, you are a winning punter over the long run regardless of short-term results. If your average CLV is negative, you are a losing punter even if your short-term record looks fine. The metric does not lie. The bankroll does, because variance hides the truth for months at a time.
The honest reading of negative CLV
Discovering you have negative CLV is one of the most useful experiences in a betting career. It is uncomfortable. It feels like a verdict. It is, in the right sense, exactly that.
The honest reading is to identify which kinds of bets are generating the negative CLV. Player props might be neutral while spreads are heavily negative. Totals might be positive while moneylines are draining value. The breakdown by market type is where the improvement starts. Most punters who track CLV honestly discover they have an edge in one or two specific markets and a leak in others. The discipline is to bet only where the edge is and stop betting where the leak is.
The deeper reading is to identify which information sources are producing positive CLV bets and which are producing negative CLV bets. If your bets driven by lineup news are positive but your bets driven by recent ATS records are negative, the data is telling you which inputs to trust. If your bets driven by pace analysis are positive but your bets driven by player matchups are negative, again, the data is showing you where you are sharp and where you are guessing.
This is essentially the analytics-driven approach Shane Battier described when he played in the 2010s, framing betting and decision-making like blackjack rather than gut, doubling down on situations where the percentages favour you. The percentages in betting are revealed by CLV. The bets where you consistently beat the close are the bets where the percentages favour you. The bets where you do not are the bets where they do not. Trusting the data over the gut is harder than it sounds, and it takes a hundred bets of disciplined tracking before the truth becomes undeniable.
CLV as a long-term feedback loop
The end-state of disciplined CLV tracking is a betting practice that becomes self-correcting. You bet, you record, you compare, you adjust. The bets that consistently produce positive CLV expand in your portfolio. The bets that consistently produce negative CLV shrink and then disappear. Over a season, the average quality of your bets rises mechanically because the metric forces honest evaluation.
The compounding benefit is that CLV-based discipline survives variance. You have a 30-bet losing streak. Your record looks bleak. Your CLV is still positive. You know the streak is variance because the metric tells you the bets were priced well at entry. You bet the next session at the same sizes and continue. Without CLV, you would have started questioning your strategy, reducing stake sizes, abandoning your method just as variance was about to revert. The bookmaker’s hold structure sets the size of the margin you fight against; CLV is your scoreboard for fighting against it. The two are the same problem viewed from different sides. The hold is what you pay. CLV is whether you are paying it back.
What"s a good CLV percentage to aim for?
Anything positive is good. Professional NBA punters typically average between one and three percentage points of positive CLV per bet, weighted by stake. Recreational punters often run negative one to three percentage points without realising it. The sign of your CLV matters far more than its magnitude over small samples.
How many bets do I need before CLV is reliable?
Roughly 100 bets to see the trend, 300 to be confident. Single bets show wide CLV ranges because line movement is partly noisy. Across 300 bets the average CLV stabilises around your true skill level and the variance smooths out.
Does positive CLV guarantee winning bets?
No, but it guarantees positive expected value. You can have positive CLV across a season and still have a negative profit in that single season due to variance. Over multiple seasons, positive CLV converges to profit and negative CLV converges to loss. The metric predicts your trajectory, not your individual results.
Articles
Created by the "NBA Stats For Betting" editorial team.
