
In-Play Performance Statistics and Real-Time Line Calculation
 Available in US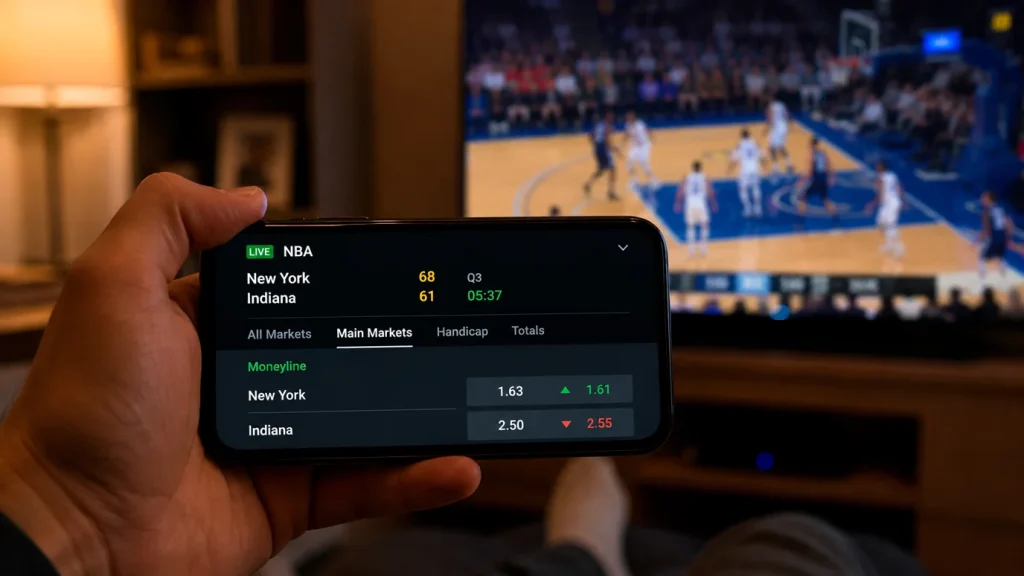
In-Play Market Dynamics: Navigating Fast-Paced Mid-Game Line Variance
I lost more money in my first six months of live NBA betting than I had in two previous years of pre-game betting combined. The reason was simple. I had not understood that live markets are a different product. The pre-game line is a forecast. The live line is a continuously-updating reaction to what just happened on the floor. Treating them as the same product, with the same analytical approach, is the surest way to give back any pre-game edge you have built.
Live NBA betting in 2025-26 is bigger, faster, and more sophisticated than ever. Bookmakers run continuous live trading desks, automated models that reprice every market every few seconds, and human risk managers who tilt prices when public action loads one side. For UK punters watching late-evening games, the live market is where the most opportunity sits and where the most damage happens. This article is the practical framework I wish I had built in those first six months. The maths, the signals, and the structural traps.
What the live model is actually doing
The book’s live model is doing one thing in real time. It is projecting the remaining minutes of the game forward, using the current score, the current pace, the current efficiency, and the lineup on the floor. Every shot, every turnover, every substitution updates the projection. The live total and live spread are continuously updated forecasts of the rest of the game.
The model has some structural blind spots. It tracks score and time accurately. It tracks pace accurately within the game. It tracks shooting variance somewhat. But it generally does not read tactical setup as well as a human watching the game can. When a defence has just gone to full-court pressure, the model does not know that pressure will probably continue for the next two minutes. When a coach has just called timeout, the model does not know what was said in the huddle. When a team’s rotation has shifted and a non-elite ball-handler is suddenly on the floor against pressure, the model does not weight that as heavily as it should.
The gaps between what the model reads and what a human can read are where live edges live. They are not large. They are not frequent. But they are real, and they recur in predictable patterns through the game.
Pace pivots: the single biggest live signal
The most consistent live signal in modern NBA betting is the pace pivot. A team’s pace can shift dramatically within a game. Lineup changes, foul trouble, deliberate slowdowns, and tactical adjustments all change the rate of possessions per minute. When pace shifts and the live total has not yet caught up, the over-under price is structurally wrong.
The mechanics work like this. Pre-game pace expectation is set by season-long averages. During a game, pace can deviate from that average for reasons that are visible to a watcher but slow to register in the model. A team that benched its bench-leading ball-pusher in favour of a slower lineup will play slower for the duration of that rotation. The live total assumes pace continues at the recent rate, with a slow decay back to season average. The reality is that the lineup-driven pace change will hold for as long as the lineup is on the floor.
The empirical baseline matters here. The league averages 101.9 possessions per team per 48 minutes in 2025-26, the highest pace in 30 years. Quarter-to-quarter pace within a single game can swing by 20 possessions per 48-minute equivalent depending on lineups and game state. The live total moves a quarter-point per implied scoring change. The lag between visible pace shift and live total reaction is typically 30 to 90 seconds. That window is where live total bets find edges.
Q4 pace decay and live unders
The single most repeatable live edge in NBA betting is the Q4 under in close games. The mechanism is structural and the evidence is solid. Research analysing more than 2,000 NBA games found that approximately 19 percent of games entered Q4 with a margin of 10 points or fewer, and in those close games the median pace dropped to between 90 and 100 possessions per 48-minute equivalent, compared to a first-half pace of around 104.5.
The shooting story compounds the effect. Research on quarter-by-quarter shooting accuracy showed an effect size of -1.27 (Cohen’s d) for the drop between Q1 and Q4. The drop is sharper on three-point shots than on rim shots. Combined with the pace decay, the result is total scoring in Q4 of close games that runs 15 to 20 percent below what a “per-quarter average” model would project.
For a live punter, the workflow is straightforward. Watch for games that arrive at the start of Q4 within 10 points and have produced near-baseline scoring through three quarters. The live Q4 total in these games is often priced at or near the baseline per-quarter rate. That price is structurally too high. The pace will decay, the shooting will decline, and the Q4 under hits more often than the implied probability suggests.
The same pattern reverses in blowouts. A game arriving at Q4 with a 15+ point margin will see both teams loosen up, transition opportunities rise, and pace stay elevated or even climb. Live Q4 overs in blowouts are sometimes the cleaner side. The pre-Q4 game state is the single biggest variable in any Q4 live total decision.
Reading turnover clusters in real time
The other structural live signal in 2025-26 is the turnover cluster. The league is averaging 15.3 turnovers per 100 possessions, up from 14.3 last season — the largest year-on-year increase in over a decade. The cause is the press wave. Twenty of 30 teams have raised their defensive point of pressure, applying full-court or three-quarter-court ball pressure on a far higher share of possessions than they did last year.
The live application is what I call the press-and-cluster pattern. When a team that plays a high-pressure scheme starts extending its defence early in a quarter, the next two to three minutes are more likely to produce a turnover cluster than the random baseline suggests. The live total tends not to move on the first turnover, but it moves sharply on the second. The window between the first turnover and the line’s reaction is the actionable one.
The framework for reading the setup involves three markers. Defensive scheme on consecutive possessions (the press is intentional and continuing). Offensive personnel weakness (two non-elite ball-handlers on the floor together). Possession context (the offence is in transition, the shot clock just ran low, or there has just been a foul call that disrupted the rhythm). When two of these three markers are present and the live total is still at its recent baseline, the over on the next two-minute window often clears.
The traps that drain live betting bankrolls
Three live betting mistakes account for the majority of money lost.
The first is reacting to scoring rather than predicting it. The live total has already moved by the time a 12-2 run is on the board. Betting the over after a hot stretch is buying retrospective value. The book has already repriced. The trade is to anticipate the next run before it starts, using the structural signals above, not to react to the run that just happened.
The second is betting too many markets too often. Live markets are exhausting to trade well. Each game has dozens of bettable moments, and most of them are not edges. Disciplined live punters bet two or three windows per game at most, sized carefully, and pass on the rest. Recreational punters bet every dramatic moment and accumulate a loss rate that the maths cannot sustain.
The third is ignoring the maths of live margins. Live markets carry slightly wider margins than pre-game markets because the operator’s risk is higher and the data is less stable. The hold can run 6 to 8 percent on live versus 4 to 5 percent pre-game. That extra one or two percent margin per bet compounds heavily when you trade frequently. You need a real edge per bet to overcome the live hold, not just an opinion. The quarterly market structure is the structural backbone of all of this — the per-quarter rhythm and decay pattern is what determines where the genuine live edges sit, and it is the framework I return to before every live bet I size.
What"s the cleanest live NBA bet for a beginner?
The Q4 under in a close game where the first three quarters tracked near baseline scoring. Pace and shooting both decline in Q4 of close games, and the live market often prices the Q4 line at or near the baseline rate, which is structurally too high. Watch the pre-Q4 margin and the per-quarter scoring rate.
Are live margins really wider than pre-game?
Yes. Live NBA markets typically carry 6 to 8 percent margin compared to 4 to 5 percent pre-game. The operator"s risk per second is higher and the data inputs are less stable, so the price-in margin is larger. Live trading has to overcome that wider hold to be profitable.
How many live bets per game is reasonable?
Two or three windows per game maximum. Each window is a specific setup where the structural signal is clear and the price has lagged. Betting every dramatic moment in a game produces a loss rate that the maths cannot sustain. Live discipline is about selectivity.
Articles
Prepared by the NBA Stats For Betting editorial staff.
