
Spread Coverage Datasets and Statistical Sample Analysis
 Available in US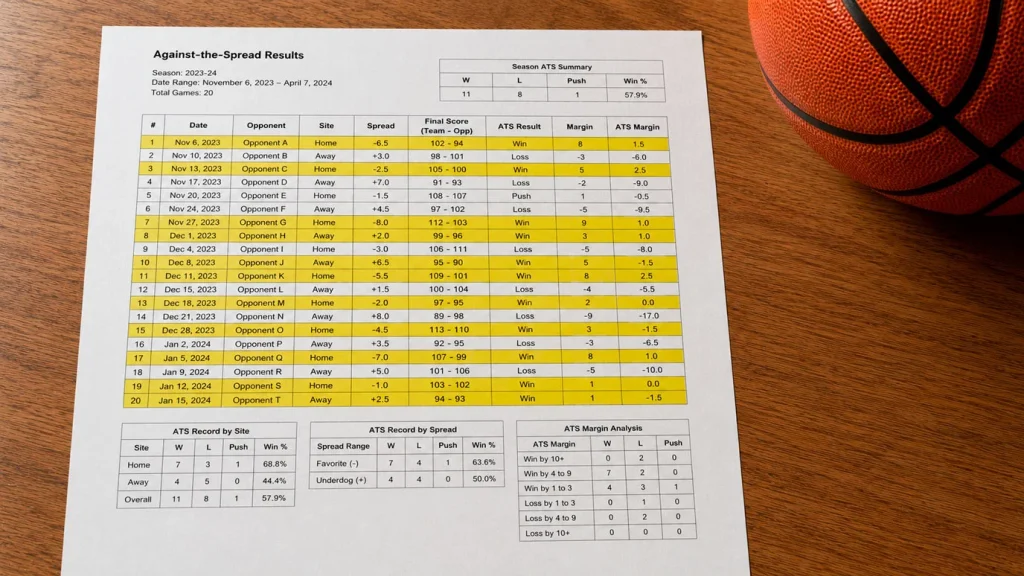
Statistical Fallacies: Evaluating Misleading ATS Trends Intelligently
The single most overused piece of “analysis” on NBA betting forums is the trailing ATS record. “Team X is 8-2 ATS in their last 10.” “Team Y has covered six of their last seven on the road.” The implication is always the same: this trend means something, so back it. Nine times out of ten, the trend means almost nothing, and backing it produces returns that are no better than random.
ATS records are useful in narrow, specific ways. They are dangerous in the broad, generic way most punters apply them. The line between useful and dangerous is mostly about sample size, context, and what the underlying data is actually capturing. This article is the careful version of that distinction. By the end, you should know when an ATS record is genuine information and when it is recency-bias dressed up as data.
ATS versus SU: a quick refresher
For anyone new to UK NBA betting, the terminology matters. ATS stands for “against the spread” — a team’s record relative to the point spread their games were priced at. SU stands for “straight up” — a team’s win-loss record without reference to the spread. The two records can diverge significantly. A great team can have a poor ATS record because they are consistently priced as heavier favourites than they actually outperform. A poor team can have a strong ATS record because they consistently outperform the underdog spread the market gives them.
ATS is the more useful record for assessing whether a team has been pricing accurately at the market level. SU is the more useful record for assessing pure team strength. A team at 25-15 SU and 18-22 ATS has been winning often but underperforming their spread expectations — a sign the market is overrating them. A team at 18-22 SU and 22-18 ATS has been losing often but outperforming their spread expectations — a sign the market is underrating them. For pure betting purposes, the second team is the interesting one.
The complication is that ATS records, like all betting records, are dominated by variance over short samples. Forty games of ATS data contains substantial noise around the team’s true expected cover rate. Drawing strong conclusions from 40 games of ATS evidence is one of the most common ways to lose money systematically.
Sample size and the 50-game myth
The most useful single concept in ATS analysis is the confidence interval around an observed cover rate. The maths is unforgiving. To distinguish a team that covers at 55 percent from a team that covers at 50 percent at any reasonable statistical confidence, you need approximately 200 games of evidence. In NBA terms, that is two and a half full seasons. Anything less, and the difference between “covering at 55” and “covering at 50” cannot be reliably extracted from the noise.
What this means is that almost every trailing ATS split you see on a betting site is statistically meaningless on its own. “8-2 in their last 10” tells you that team has covered 80 percent of a 10-game sample. The 95-percent confidence interval around that sample, given a true mean of 50 percent, is wide enough to easily contain 80 percent. Random coin flips produce 8-2 streaks regularly. Treating the trend as a forecast is forecasting noise.
The legitimate use of small-sample ATS records is as a flag, not a forecast. An 8-2 trailing ATS record does not predict the team will cover the next game; it flags the team for further investigation. Why have they been covering? Is there a structural reason — improved lineup health, schedule shift, new system implementation — that justifies the recent results? If yes, the trend is genuine information. If no, it is variance, and the next 10 games will probably regress. The honest workflow is to use the ATS record as a starting point, not a finishing point. As Shane Battier described his own decision-making framework when analytics started shaping the league, the underlying approach is more like blackjack than gut: when the percentages favour you, you double down because the maths gives you the best chance over time. But the percentages have to be real, not the after-image of a coin flip going the same way ten times.
Useful ATS splits: rest, home/road, divisional
Not all ATS splits are equally useful. Three categories carry more weight than the generic “trailing 10” framing.
The first is rest splits. A team’s ATS record on zero days rest versus their record on two or more days rest can be genuinely informative, because the underlying schedule context is consistent. Teams on zero days rest have produced specific performance patterns over multiple seasons, and ATS data in this split adds the market-pricing dimension. Where the home win rate of 54.4 percent in 2024-25 captures the new normal for home-court advantage, the ATS record by rest-day differential captures how often that home advantage is correctly priced.
The second is home and road splits. A team’s home ATS record versus their road ATS record over a meaningful sample (60+ games each) is informative about how the market prices their home advantage specifically. A team that covers at 55 percent at home but only 45 percent on the road is being overrated by the market on the road and possibly underrated at home.
The third is divisional and conference splits. Teams play their division opponents four times per season and their conference opponents three or four times each. The familiarity factor — coaching staffs and personnel knowing each other’s tendencies — produces measurable effects on ATS outcomes. Divisional ATS records are often more predictive than overall ATS records because the underlying matchup dynamics are repeat-encounters rather than novel.
What these splits have in common is that they isolate a specific structural variable. Generic “trailing 10” splits combine many different variables — opponent quality, rest, home/road, injury status — into one number that averages out the underlying structure. Isolated splits with consistent structural inputs are where ATS data starts being useful.
The four ATS traps to avoid
I will close with the four mistakes I see most often, in rough order of damage done.
The first is treating recent ATS streaks as forecasts. As covered above, small-sample trends rarely have predictive value. Use them as flags for further investigation, not as primary inputs to a betting decision.
The second is ignoring opponent quality in ATS splits. A team that covered eight of their last ten against weak opponents is providing very little information about how they will perform against strong opponents. ATS splits filtered by opponent quality — top-10 net rating opponents versus bottom-10, for example — are far more informative than raw ATS records.
The third is confusing “covering” with “winning correctly.” Teams cover spreads partly because their team strength is being mispriced, and partly because of random variance. Over a season, the cover rate of any team should converge close to 50 percent — the market is designed to balance to that. Deviations are temporary. Long-term, you cannot pick teams based on their ATS record alone; you need to know why the market is mispricing them, which moves the analysis upstream of the cover rate itself.
The fourth is back-to-backs as a public trend. Most punters know that teams on zero days rest perform worse — they win roughly 4 percent less often than their talent base predicts, with the average team underperforming by about 2.5 points on the spread. This is well-known enough that the market prices it. The basic back-to-back fade is no longer an edge. The edge in back-to-back betting sits in the secondary variables — direction of travel, road trip cumulative fatigue, specific roster impacts of rest decisions. The basic ATS pattern is already in the line. The CLV framework is the cleaner way to assess whether your ATS-based picks are actually beating the close, which is the only score that matters over time.
What sample size is needed before an ATS trend becomes meaningful?
Roughly 200 games to distinguish a 55 percent cover rate from a 50 percent cover rate at standard statistical confidence. In NBA terms that is two and a half seasons. Anything less is mostly variance. Use small-sample ATS as a flag for investigation, not as a forecast.
Do "last-10 ATS" splits actually have predictive value?
Limited, on their own. The 10-game window is too small to extract a reliable signal from the noise. Where last-10 splits matter is when they reflect a structural change — improved health, new coach, schedule shift — that is likely to continue. If you cannot identify the structural reason, the trend is probably variance.
Should ATS history be combined with team ratings?
Yes. ATS history tells you how the market has priced a team. Team ratings (net rating, ORtg/DRtg) tell you what the team actually is. When the two disagree — strong ratings with weak ATS, or weak ratings with strong ATS — that gap is where most of the betting information lives.
Articles
Created by the "NBA Stats For Betting" editorial team.
